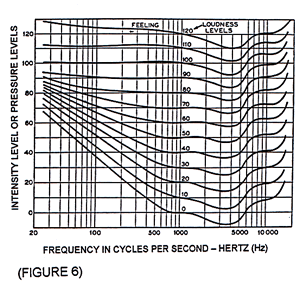
| Our ears do
not perceive all sounds equally at the various frequencies or sound intensities.
(FIGURE 6) shows an equal loudness contour chart. The sound levels for
a particular sound as defined by the level at 1000 Hz will find the same
for any given frequency along the curve. For example a 20-decible sound
at 1000 Hz would be perceived as the same sound level of 50 decibels at
100 Hz. This indicates that our ears are less sensitive to low frequency
sounds than mid to high frequencies. As will be seen later, this sensitivity
difference will feature repeatedly in the control of noise. |
 |
