| Return to www.asiproaudio.com | Print Page |
SPEECH INTELLIGIBILITY TEST RESULTS FOR GRADES 1, 3 AND 6 CHILDREN IN REAL CLASSROOMS |
|
John S. Bradley* and Hiroshi Sato** Abstract The WIPI (Word Intelligibility by Picture Identification) test was used in classrooms to assess the word recognition performance of 1st, 3rd and 6th grade schoolchildren for varied speech-to-noise ratios (S/N). The effects of age from the classroom tests were compared with baseline data obtained using young adults in simulated sound fields. The young adults completed the WIPI test, a Rhyme test, and a Listening Difficulty test in the simulated sound fields to make it possible to compare the results of these three test procedures and to act as baseline data for comparison with the classroom results of the children. There were highly significant effects of age and S/N. The results will help to more accurately define the needs of young listeners in actual classroom conditions. 1. Introduction A number of studies have shown that younger listeners need better signal-to-noise ratios (S/N) to obtain the same speech recognition scores as older listeners [1-3]. However, there is not a precise picture of how the effects vary with age for actual classroom listening conditions. Most previous studies were laboratory tests of small numbers of individual students and most often they have been carried out using monaural headphone listening. We would expect much better discrimination of speech in noise with binaural listening as normally occurs in classrooms [4]. Many previous studies have used young adult subjects and do not show the inferior results expected for younger listeners. A number of previous experiments have examined the negative effects of reverberation but without indicating any understanding of the beneficial effects of room reflections on S/N and speech recognition scores [4,5]. Thus, they would conclude that a reverberation time of 0 s would lead to the highest intelligibility scores. This is quite misleading because it ignores the related effects of early reflections that have very significant beneficial effects on the effective S/N values and hence also on speech recognition scores [6]. Many previous studies have used multi-talker babble as a masking noise [2,5]. This may exaggerate masking effects compared to those for typical ambient noises such as ventilation noise. Several studies have demonstrated that speech is a more interfering signal than either constant amplitude or amplitude-modulated noise [7].
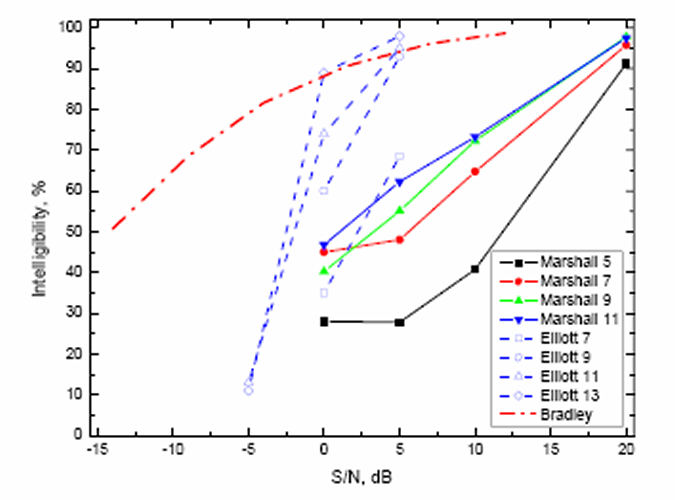
Figure 1 illustrates some examples of the divergence of results from previous studies. Marshall used the WIPI test on children aged 5, 7, 9 and 11 [3]. The speech and noise signals were presented monaurally using headphones. Elliott used a different type of speech test but again used monaural presentation for a wide range of subject ages [1,2]. Bradley carried out tests using the Rhyme test with complete classes of students in actual classrooms but only produced results for one age group (12-13 year olds) [8]. The results are quite divergent and often differ from the results obtained by students listening binaurally in actual classroom situations. We need to know how children's ability to recognize speech as a function of S/N, and under completely realistic conditions, varies with age in order to better establish ambient noise criteria for their classrooms. To meet this need, the present work carried out speech recognition tests in actual classrooms for grades 1, 3 and 6 students in schools near Ottawa, Canada. 2. Method The WIPI test was used because it is easy to explain to listeners of a wide range of ages [3,9]. It consists of simple test words said to be familiar to 5 year olds and these were presented in the carrier phrase, "Please mark the _____ now." The students responded by placing a sticker on one of 6 pictures to indicate the correct word. The students sat at their desks in their regular classroom. The tests were carried out in 41 classrooms evenly distributed among grade 1, grade 3, and grade 6 students (6, 8, and 11 year olds). A total of 840 students were evaluated in 41 classrooms. Grade 1 students were tested at 2 different S/N values and the other students at 3 different S/N values to give a total of about 2200 individual speech recognition tests. The sound source was a small loudspeaker with similar directionality to that of a human talker. Digital recordings of the WIPI test material, made in an anechoic room, were edited to use exactly the same version of the carrier phrase for all test words and to have the same sound levels for all test words. Varied S/N were obtained by changing the playback level of the speech material relative to the existing ambient noise. Speech and noise levels were recorded during the tests at 4 positions in each classroom. There were about 5 students near each microphone. These recordings were used to determine speech and noise levels during the tests by statistical analysis of the distribution of recorded sound levels [10]. Room acoustics parameters were also measured from impulse responses obtained at the same locations [10]. These included decay times, energy ratios, Useful/Detrimental ratios and STI values. The same WIPI test was used to evaluate conditions intended to simulate those in classrooms, but with young adult listeners. The simulations were achieved with an 8- channel electro-acoustic system in an anechoic room. The simulated sound fields consisted of a direct sound, and early reflections followed by a reverberant tail representative of those found in the real classrooms. These speech sounds were combined with a 48dBA ambient noise having a spectrum shape representative of ventilation noise. The 8 test conditions included the combinations of 4 S/N values and two different room acoustics conditions. The two room acoustics conditions corresponded to: (a) the average condition measured in the real classrooms with a 0.5 s reverberation time and (b) the other representing a more reverberant classroom with a 1.0 second reverberation time. This part of the work also used the Rhyme test and Difficulty ratings [11]. It was intended, that these results for young adults, would provide baseline data for the effects of listener age and also allow us to compare with other previous results. 3. Results 3.1. Classroom Tests
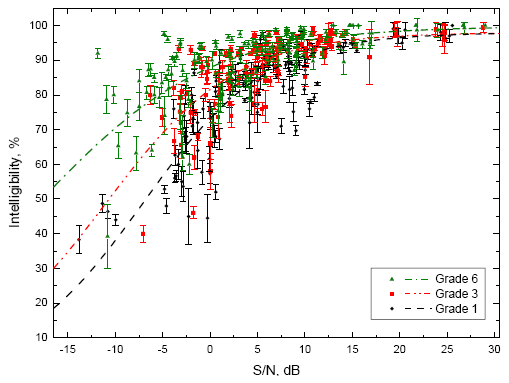
Figure 2 shows the mean speech intelligibility scores of each group of students associated with a particular measurement microphone position. They are plotted versus S/N separately for the grades 1, 3 and 6 students. An analysis of variance of the scores showed that there were highly significant main effects of age and S/N as well as a significant interaction effect of these 2 independent variables. That is, although there is significant scatter in the results, there are highly significant effects related to the age of the listeners. The younger children clearly need higher S/N to obtain the same intelligibility scores as the older children in this group. The large scatter at lower S/N values is probably indicative of how students react to more difficult listening conditions. At lower S/N, some students can still do quite well, but others more or less give up and get much lower scores.
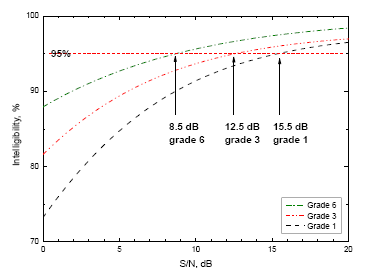
Figure 3 shows an expanded view of the best-fit regression lines from Figure 2. The performance of the 3 age groups can be compared by considering the required S/N for 95% intelligibility scores indicated by these mean trend lines. While grade 6 students could, on average, achieve 95% correct scores for a S/N of +8.5 dB, the grade 3 students required +12.5 dB S/N and the grade 1 students +15.5 dB S/N. In this case there is a 7 dB difference between the needs of grade 1 and grade 6 students. Of course, higher S/N values would be necessary for the students to obtain higher speech intelligibility scores, closer to near perfect understanding of all speech. For very high S/N cases (+20 to +30 dB), the grade 1 and 3 students scored ~98% correct and the grade 6 students ~99.5% correct, indicating that all students can do very well on the WIPI test in actual classrooms when there is minimal masking noise. 3.2. Tests in Simulated Sound Fields with Young Adult Listeners
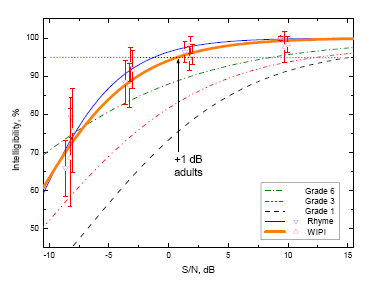
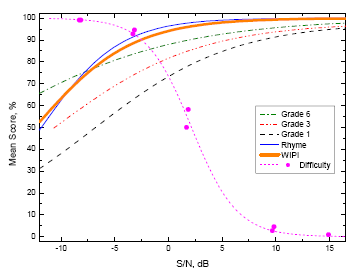
Figure 4 shows the results of baseline speech tests using young adult listeners in simulated sound fields intended to be representative of conditions found in classrooms. The young adults performed both the WIPI test and the Rhyme test so that the current results using the WIPI test could be compared with various older studies that have used the Rhyme test. Figure 4 also includes the best-fit regression lines to the new classroom results from Figures 2 and 3. The test results for young adults show mean scores that are clearly better than those for the grade 6 students at most S/N values. This is partly due to age differences between the adults and the grade 6 students and is also probably influenced by the different test conditions. The laboratory tests of the adults did not include some factors present in the classroom tests such as the distractions of other students. The young adults have a mean score of 95% correct at a S/N value of +1 dB, which is a considerably lower S/N than for the students.
Although the young adults got very high scores for S/N> +1 dB, they still thought they had difficulty in perceiving the speech sounds as indicated by the Difficulty ratings in Figure 5. These are the results of a third test that the young adult subjects performed in the simulated sound fields in which they gave subjective ratings of the Difficulty of understanding speech material [11]. In the range of S/N values from +1 to +20 dB, where the younger students show increasing intelligibility scores, the adults expressed decreasing difficulty. Thus, the adults have developed the skills to understand speech in more difficult conditions but they still require extra effort to do this and they find it more difficult to listen in these conditions where there are less than ideal S/N values. It is not clear how children would rate the Difficulty of the same situations because only young adults were tested. 4. Room Acoustics Effects It was hoped that the selection of classrooms would include significant variations in room acoustics characteristics. Unfortunately this was not the case and mid-frequency reverberation times varied only between 0.3 and 0.7 s for the occupied classrooms [10]. As a result, initial analyses of possible relationships between speech intelligibility scores and room acoustics parameters were inconclusive. For example, when the speech intelligibility scores were plotted versus A weighted Useful-to-Detrimental sound ratios, the resulting relationships were no better than those in Figure 2. Because S/N was deliberately manipulated over about a 40 dB range it had by far the dominant influence of speech recognition scores. 5. Conclusions The results of the speech intelligibility tests in classrooms with grade 1, 3, and 6 students show clear effects of the age of the students. Grade 1 students are seen to require, on average, conditions with 7 dB better S/N than grade 6 students to achieve the same 95% correct speech intelligibility scores. Young adults had, on average, substantially better speech intelligibility scores than the students for conditions with the same S/N value. While the adults obtained higher speech intelligibility scores, they still expressed difficulty in understanding the speech for the conditions of less than ideal S/N values. It may be that young students would have even higher levels of difficulty than the adults. The young adults were tested in more ideal laboratory conditions without the additional distractions of real classrooms. Further experiments are required to more completely connect the results for the young adults with those for the students. The measurements of S/N values in these classrooms during normal teaching activities had a mean S/N of 11 dB [10]. For this average condition, the grade 1 students would understand only 92% of the teacher's speech. Of course, a significant number of the grade 1 students would understand much less than this average. The grade 3 students would perform only 2% better. Clearly many common classroom situations do not provide ideal acoustical conditions where younger students can understand all that is said by their teacher. 6. Acknowledgements The authors are grateful for the financial support and collaboration of the Canadian Literacy and Language Research Network and for the help of Ms. Kimberlee Cuthbert in carrying out these experiments. They are also very appreciative of the help of the audio group at the Banff Centre for their help in editing the speech recordings. 7. References [1] Elliott, L.L., "Effects of noise on speech by children and certain handicapped individuals," Sound and Vibration 16, 10-14, (1982). [2] Elliott, L.L. "Performance of children aged 9 to 17 years on a test of speech intelligibility in noise using sentence material ~ with controlled word predictability", J. Acoust. Soc. Am., 66,651-653 (1979). [3] Marshall, N.B., "The effects of different signal-tonoise ratios on the speech recognition scores of children", Ph.D. Thesis, University of Alabama, Tuscaloosa Alabama, (1987). [4] Nabelek, A.K., and Pickett, J.M., "Reception of onsonants in a classroom as affected by monaural and binaural listening, noise, reverberation andhearing aids," J. Acoust. Soc. Am. 56, 628-639, (1974). [5] Finitzo-Hieber, T, and Tillman, T.W., "Room acoustics effects on monosyllabic word discrimination ability for normal and hearing impaired children," J. Speech Hear. Res. 21, 440 - 458, (1978). [6] Bradley, J.S., Sato, H. and Picard, M., "On the importance of early reflections for speech in rooms", J. Acoust. Soc. Am. 113 (6) 3233-3244 (2003). [7] Carhart, R., Tillman, T.W., Greetis, E.S., "Perceptual masking in multiple sound backgrounds", J. Acoust. Soc. Am. 45, 694-703 (1969). [8] Bradley J.S., "Speech intelligibility studies in classrooms", J. Acoust. Soc. Am., Vol. 80, No. 3, 846-854, (1986). [9] Ross, M., and Lerman, J., "A picture identification test for hearing-impaired children", J. Speech and Hearing Research 13, 44-53 (1970). [10]Sato, H. and Bradley, J.S., "Evaluation of acoustical conditions for speech communication in active elementary school classrooms", Proceedings of ICA, Kyoto (2004). [11] Sato, H., "Subjective measures to evaluate speech intelligibility, quality and difficulty in rooms for young and elderly listeners", Canadian Acoustics, 30 (3) 50-51 (2002). |